vis.js 2: Style Configuration
18 Apr 2014Continuing on from an earlier post, in this post we are going to look at some customisation options for vis.js.
A lot can be customised in vis.js. Some options, like those for layout, affect the entire graph. Other options, like node colours and shapes, affect nodes or groups of nodes. Yet other options, like width and style, affect edges.
As this blog is focused on graphs that arise in graph theory (as opposed to Network Analysis or other data-based disciplines) we will aim to reproduce a traditional style of graph drawing reminiscent of the simple black and white line drawings found in books and papers on graph theory. In future posts we will investigate visualisation of colouring algorithms and it will be useful to have such a default un-coloured style.
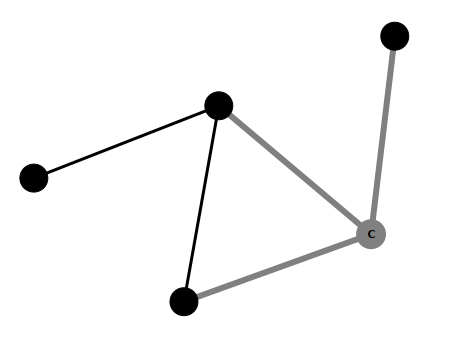
We are going to aim for the style of graph shown in this example. Black vertices, no labels, straight edges and a layout that tries to minimise edge-crossings as far as possible.
There are three steps. First we configure options related to the graph layout, then we style nodes and finally we style edges.
Graph Options
In an upcoming post we will look more closely at the different layout algorithms in vis.js and options for configuration of physics modelling that allows for dynamic interaction with the rendered graph. In this post we will settle for a layout with straight edges where nodes are placed by a repulsion algorithm.
To configure vis.js to produce such a layout involves nothing more than setting
the value of two properties of the options object. This options object is then
passed as a parameter to the Graph function.
The smoothCurves property has the default value of true and by changing
this to false we require vis.js to use straight edges to join nodes.
The physics property supports a wide range of options but here all we want
is to disable the Barnes-Hut layout algorithm and revert to a simpler
repulsion layout. This is done by setting to false the value of the
enabled property of the barnesHut property object.
The code below is written in CoffeeScript and we use the
coffee compiler to translate it into Javascript.
options =
  smoothCurves: false
  physics:
    barnesHut:
      enabled: false
With the CoffeeScript compiler installed and the above code contained in a file
called options.coffee we can produce Javascript output with:
$ coffee --compile --bare options.coffee
Then to configure all graphs in a HTML document we simply have to link to the resulting Javascript source.
For more information about graph options in vis.js see the graph options pages of the vis.js documentation.
Node Styling Options
Our goal is to have nodes rendered as black filled circles. The shape of a
node is configured by setting the value of the shape property of the
nodes object. The color property is a little more complicated. It
allows us to specify separately the colour of the border and background of a
node. We can also set different values for the border and background when the
node is highlighted.
nodes:
  shape: 'circle'
  fontColor: 'black'
  color:
    border: 'black'
    background: 'black'
    highlight:
      border: 'grey'
      background: 'grey'
By choosing to have a black font colour gives a nice side-effect; labels are not visible on unhighlighted nodes. This is consistent with the graph theory setting where unlabelled graphs are prevalent.
We have opted for a subtle highlight effect by setting both border and background to grey. This colour scheme makes node labels visible when selected.
For a comprehensive list of node options see this page vis.js documentation.
Edge Styling Options
The main difference between the default styling of vis.js edges and the
textbook style we are aiming to reproduce is that edges are curves instead of
straight lines. To remedy this requires only that we choose the 'line'
option for the style property in the edges object.
edges:
  width: 3
  style: 'line'
  color:
    color: 'black'
    highlight: 'grey'
The only other changes we have made are to increase the thickness of the edges
by setting the value of the width property and choosing grey as the
highlighting color of edges to match the highlighting of selected nodes.
For a comprehensive list of edge options see this page vis.js documentation.
Conclusion
The above configuration gives graph visualisations that looks something like the traditional line drawings found in graph theory literature.
For now we do not have complete control over the layout. It is generated by the repulsion algorithm and our interactions after loading the page. In future posts we will discuss how to configure both the layout algorithms and the dynamic interactions.
To learn more about the different options that can be configured in vis.js (of which we have only seen here a small sample) see the gallery on the vis.js homepage. Some examples that are particularly relevant are:
- Shapes example,
- Sizing example,
- Dashed lines example,
- Custom style example.