vis.js I: Creating and Displaying Graphs
28 Mar 2014This is the first post in a series about vis.js, a Javascript library for dynamic browser-based visualisations of graphs and timelines.
vis.js has four main components DataSet, DataView, Timeline and
Graph. In this post and subsequent posts about vis.js we will only
consider the Graph component, used for creating and displaying graphs.
The goal of this post is to reproduce a very simple example of a webpage with embedded graph visualisation. So that the code will be as simple as possible we will create and draw a very simple graph, the complete graph on three vertices \(K_{3}\).
To see a live demonstration of the example we are going to recreate you can look here. The complete source code of the example can be found in this gist on Github or at the end of this post.
Installing vis.js
As vis.js is a Javascript library the easiest way to use it is by creating a simple webpage.
<html>
 <head>
  <title>vis.js Graph demo</title>
  <script src="http://visjs.org/dist/vis.js"></script>
  <link href="http://visjs.org/dist/vis.css" rel="stylesheet" type="text/css" />
 </head>
 <body>
  <div id="graph"></div>
 </body>
</html>
The important things to notice here are the script and link elements in
the header and the empty div element in the body.
The script element links to the vis.js source at the visjs.org website and
link element links to the vis.js css file.
The empty div serves as a container for the drawing of the Graph object
we will create with vis.js.
Creating a graph
Creating a Graph object in vis.js is done by calling the Graph function
with arguments for the container and graph data. A third argument allows us
to pass in options about how to render the graph.
The nodes of our graph are an array of objects. Each object must have an
id. A label property can also be given and its value will be used as a
label when the graph is rendered. If no labels are given then vis.js uses ids
as labels.
var nodes = [
  {id: 1, label: 'a'},
  {id: 2, label: 'b'},
  {id: 3, label: 'c'}
];
The edges are similarly an array of objects. Each object defines a from and
to property and represents an edge in the graph with end nodes given by the
id values of these two properties.
var edges = [
  {from: 1, to: 2},
  {from: 1, to: 3},
  {from: 2, to: 3}
];
Now to create a graph in vis.js, first pack the nodes and edges into a data object
var data = { nodes: nodes, edges: edges };and then grab the container from the document object
var container = document.getElementById('graph');Finally, call the Graph function with container and data as the
first two parameters.
var graph = new vis.Graph(container, data, {});The third argument is for an options object. This will be introduced in a subsequent post. For now, we choose default options by passing an empty object.
Displaying a graph
Opening the finished webpage in a browser should display a dynamic, interactive image that looks something like:
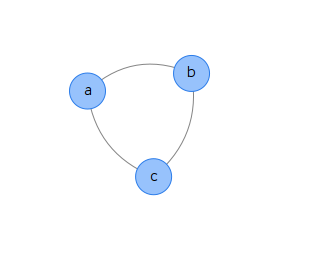
Unlike this static image, the drawing of \(K_{3}\) rendered by the browser when opening the finished webpage should respond to a variety of manipulations. You should be able to zoom and drag the graph around as well as independently manipulate node and edge components.
In upcoming posts we will discuss how to set options to create different drawings and how to import graphs from other software packages. We will also explain some of theory behind the algorithms used for drawing the graph and the physics of modelling the motion of the graph in response to user input.
Source code
References
- vis.js homepage
- Source code for the example above.
- The example above rendered as a webpage.