vis.js 3: DOT Language Support and Layout Configuration
16 May 2014In this post we demonstrate how to take a graph stored in DOT format and draw it on a webpage using vis.js. The drawing uses vis.js’s repulsion layout algorithm and we also show how to customise this algorithm to improve the drawing in this one case.
The DOT language
The DOT graph description language is the graph format used by Graphviz, one of the oldest graph visualisation tools. More than just a library or an application, Graphviz is a large collection of tools for graph visualisation. In an upcoming series we will investigate Graphviz in detail. For a good introduction to Graphviz try Let’s Draw a Graph: An Introduction with GraphViz by Marc Khoury.
In this post our interest in the DOT language is due to the fact that vis.js can load graphs which are written in DOT.
DOT and vis.js
In the first two posts in this series we saw how to draw graphs using vis.js. In both of those posts the graph objects were created with vis.js directly with Javascript in the webpage. This is a reasonable approach for small graphs but a more common scenario is that we already have a graph contained in a file in some format and want to use the drawing algorithms of vis.js with this pre-existing graph data.
In this post we consider the above scenario under the presumption that the
graph data is in DOT format. If we have graph data in a format other than DOT
then we must translate it to DOT format before using vis.js. For GML this can
be done with a script gml2gv in the Graphviz project (.gv being the
standard file extension for files in DOT format).
In the remainder of this post we will show how to reproduce the drawing of the dodecahedron graph (dodecahedron.gv) in the frame below.
Requesting Graph Data
To use external graph data with vis.js needs a little more work than simply
calling a load or import function. The feature of vis.js that allow us to work
with external data in the DOT language is the ability for the the Graph
function to be initialised with a string of DOT data. So to use external data
what is needed is to first create a string of DOT data from a file in DOT
format.
To do this we have to make a HTTP request. This is best done asynchronously to allow graph data to be loaded while the page is being rendered. One approach is to use JQuery. Other approaches are possible but JQuery makes it very easy in this case.
$.ajax({
 url : "http://dl.dropboxusercontent.com/u/8432766/dodecahedral.gv",
 success : function(dot_str){
  var container = document.getElementById('graph');
  var graph = new vis.Graph(container, {dot: dot_str}, options);
 }
});
JQuery has an ajax function for making asynchronous HTTP requests. To make
a GET request we simply have to provide a url string as an argument to the
ajax function. In fact, because we are going to also provide other settings,
it is just as easy to pack the url string as a key-value pair inside an
object with other key-value pairs and pass the entire object as a parameter
to the ajax function.
In this case, the only other setting required inside this parameter object is
the success setting. The value of this setting is a function called when the
request succeeds. The data returned by the request is passed to this function
as a parameter which allows us access to the data inside the function body.
To build a Graph object from this data (called dot_str) we call the
Graph function as usual but this time the second parameter, the data
argument, is an object which contains a mapping from a dot key to the DOT
string data which was passed into the function body when the HTTP request
succeeded.
The container and options objects have been created as in previous posts.
In the next section we show how to modify the options object to customise
the layout of the graph so the resulting drawing is more suitable than the
default.
Repulsion Layout Configuration
Layouts in vis.js are determined in a dynamic way after graph data has been loaded and thus vary from one page view to the next. Nevertheless, there are some aspects of the default drawing which are consistently undesirable and that we can fix even if we can’t completely control the exact appearance of the final graph-drawing. With default settings for the repulsion algorithm a drawing obtained by vis.js of the dodecahedron graph looks something like this:
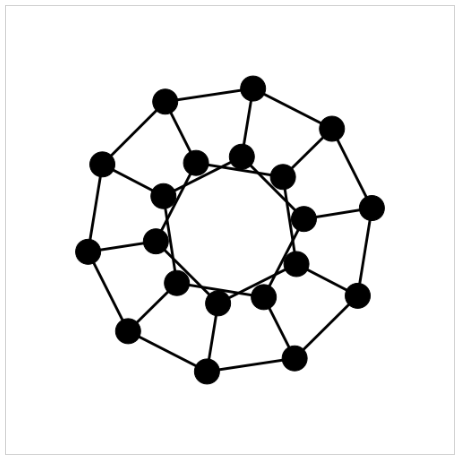
The edges in this drawing are, arguably, too short relative to the node sizes. We can fix this by allowing the repulsion algorithm to allow nodes to be placed further apart thus making nodes appear smaller relative to the drawing size.
Several variables control the behaviour of the repulsion algorithm. These variables and their effects on the graph drawing are described in the table below, which is taken from the vis.js documentation.
| Name | Type | Default | Description |
|---|---|---|---|
centralGravity |
Number | 0.1 | The central gravity is a force that pulls all nodes |
| to the center. This ensures independent groups do | |||
| not float apart. | |||
springlength |
Number | 50 | in the previous versions this was a property of the |
| edges, called length. This is the length of the | |||
| springs when they are at rest. During the simulation | |||
| they will be stretched by the gravitational fields | |||
| To greatly reduce the edge length, the | |||
centralGravity has to be reduced as well. |
|||
nodeDistance |
Number | 100 | This parameter is used to define the distance of |
| influence of the repulsion field of the nodes. Below | |||
| half this distance, the repulsion is maximal and | |||
| beyond twice this distance the repulsion is zero. | |||
springConstant |
Number | 0.05 | This is the spring constant used to calculate the |
| spring forces based on Hooke’s Law. | |||
damping |
Number | 0.09 | This is the damping constant. It is used to |
| dissipate energy from the system to have it settle | |||
| in an equilibrium. |
A very useful feature of vis.js is an interactive interface that allows you to
configure these values and then export the resulting configuration. To enable
this interface just set the value of the configurePhysics option to true.
options =
  configurePhysics: true
Now when the page is viewed we are presented with the following interactive interface which can be used to experiment with different settings for the three different layout algorithms offered by vis.js.
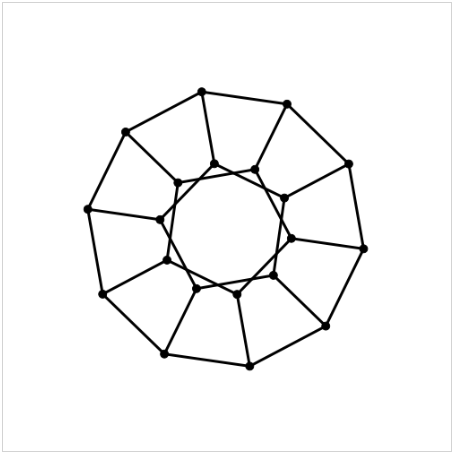
With straight edges the drawing of dodecahedron graph by the repulsion
algorithm under the default variable settings has very short edges. To increase
the edge length first increase the springLength setting, from 50 to 250, say.
Increasing only the springLength, however, results in a poor layout because
now the node distance prevents nodes from moving farther apart. The remedy is
to increase node distances. Through experimentation a value of 250 for the
nodeDistance gives a layout that makes the symmetry of the dodecahedron
clear.
When the desired settings have been found use the Generate Options button
to create option code which can be cut-and-pasted into the drawing document.
physics:
  repulsion:
   centralGravity: 0.1
   springLength: 250
   springConstant: 0.05
   nodeDistance: 250
   damping: 0.09
With those settings the drawing of the dodecahedron produced by vis.js looks something like the next image.
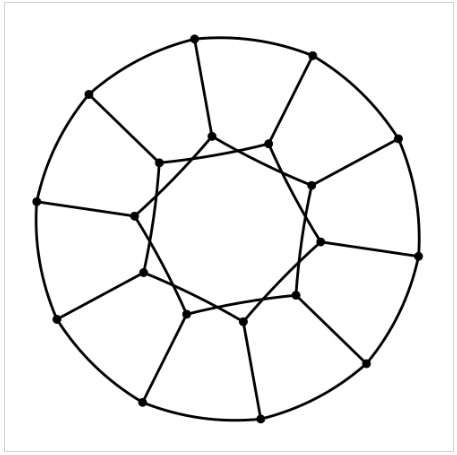
Choosing smooth curves produces a drawing with circular arcs and nearly perfect angular resolution. Such drawings are called Lombardi Drawings. See Lombardi Spirograph I: Drawing Named Graphs for further information.
Complete Source Code
The source code for the above example is shown below in a JSFiddle viewing widget. The same code is also available as a gist on Github, the output of which can be viewed on blocks.org.
Further Examples
On the vis.js homepage] this example and this playground demonstrate the use of the DOT language in vis.js.
There is also another useful example on the vis.js homepage of configuration options for the physics component of vis.js.